
This post is co-authored with Eric Hsu, Edward Miguel, and Catherine Wolfram.
Governments and foreign aid institutions routinely finance large infrastructure construction projects in developing and emerging markets. In 2015, for example, the Government of Kenya launched the Last Mile Connectivity Project, designed to connect all Kenyan households to electricity by 2022 using financing from the World Bank (WB) and the African Development Bank (AfDB). To complete construction at the approximately 20,000 villages selected for the program, Kenya Power awarded dozens of private sector contracts to procure goods and services. However, distinct processes and regulations applied to villages where construction was financed by the WB and villages where construction was financed by the AfDB. We combined this natural variation with a randomized audit experiment to understand how procurement policies impacted the timing, cost, quantity, and quality of construction on the ground in a new research paper, titled “Donor contracting conditions and public procurement: Causal evidence from Kenyan electrification.”
Kenya’s Last Mile Connectivity Project (LMCP)
In a May 2015 Presidential Address, Kenya’s president Uhuru Kenyatta launched the LMCP with the goal of connecting “one million new customers to electricity each year.” As of 2017, there were around 60,000 electrical transformers across Kenya, which convert high- and medium-voltage power lines (33kV or 11kV) to low voltage (usually 0.415kV) that can be connected to households. The LMCP was to connect all unconnected households within 600 meters of a transformer by extending the local LV network through a process called ‘maximization’. Phase I targeted the maximization of 8,520 transformers, with the AfDB financing 5,320 and the WB financing 3,200: Kenya Power assigned these in a largely arbitrary manner. Panel A of Figure 1 shows that AfDB- and WB-funded villages are distributed evenly across Kenya.
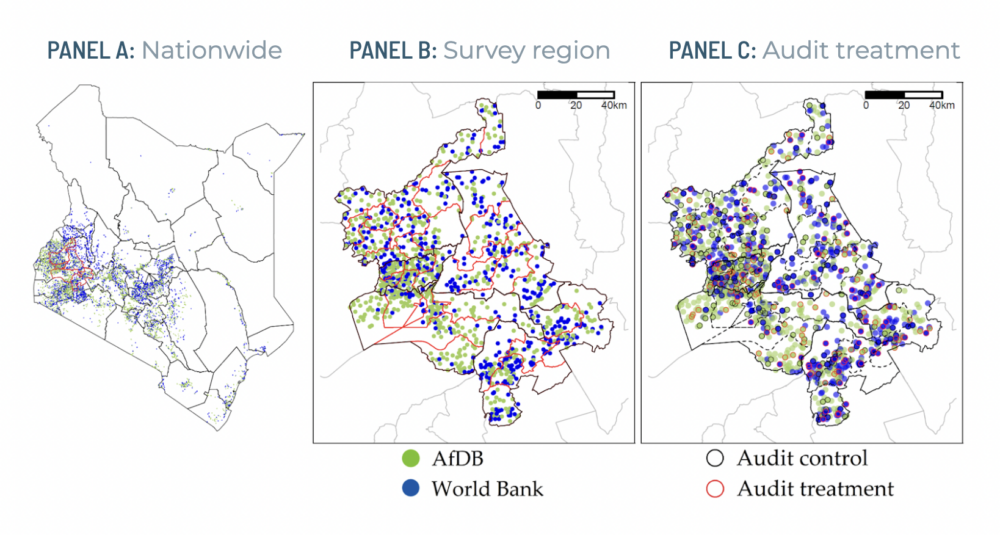
FIGURE 1: Locations of Last Mile Connectivity Project villages across Kenya
Panel A plots LMCP sites that were funded by the WB and AfDB Phase I across all of Kenya. Panel B zooms in on the sites in the five study counties (Kakamega, Kericho, Kisumu, Nandi, Vihiga). Panel C shows the random assignment to an audit treatment.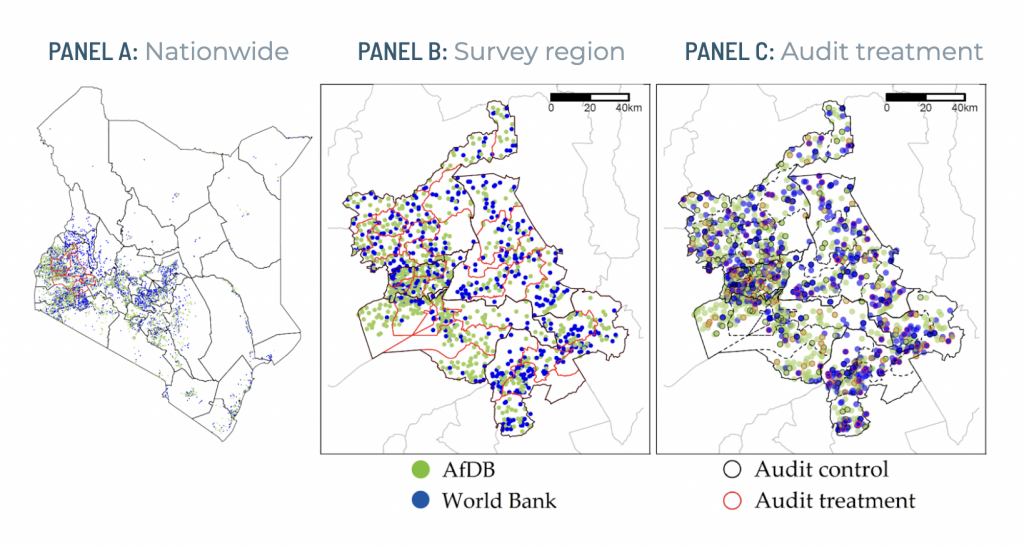
World Bank and the African Development Bank procedural conditions
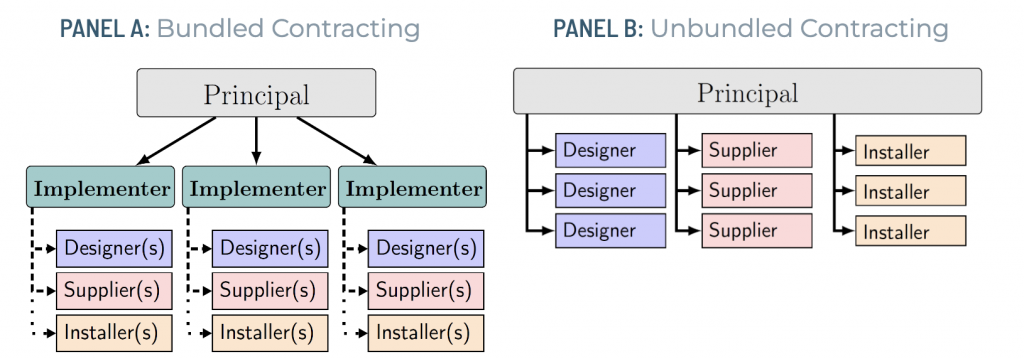
There are two key differences in the procedures used by the WB and the AfDB in this context. First, the AfDB used a bundled contracting style known as ‘turn-key’, or bundled, contracting (Panel A of Figure 2). Each AfDB turn-key contract comprised the entire construction process of all LMCP transformers in one of ten geographical clusters of counties. This included designing an efficient extension of the LV network to reach all unconnected households at a site, procuring the materials required to complete those designs, and installing materials according to the designs. Together with a metering contract and a consulting contract, Kenya Power awarded 12 LMCP contracts under the AfDB component. The WB, on the other hand, opted for an unbundled approach for the LMCP (Panel B of Figure 2), awarding 35 contracts, including four consulting contracts, eight design contracts, six contracts to procure wooden poles, three for concrete poles, three for conductors, three for cables, two for meters, and finally six contracts for installation.
FIGURE 2: Contracting structuresPanel A displays the structure of bundled contracting employed by the AfDB. Panel B displays the structure of unbundled contracting employed by the WB.
The second key difference between the funders is that the WB required an additional inspection report after construction. To understand the impact of such an ex-post inspection, we implemented a randomized controlled trial. Panel C of Figure 1 shows which sites were in the control and treatment arms. Members of our research team met with contractors in person to inform them of the randomly selected subset of treatment sites, which we tell them will be audited after construction. Given that the WB procedures already included a round of ex post audits, this additional round of audits should have a larger impact at AfDB sites than at WB sites.
Collecting on-the-ground construction and power quality data
To understand how the procedural differences affect construction outcomes on the ground, we collected data on 380 LMCP villages (shown in Panel B of Figure 1):
- GPS and engineering quality measurements of transformers, poles, and wires, as well as accessories like struts and stays.
- Household surveys on connection cost, timing, and experience.
- Minute-by-minute outage and voltage data quality from 600 households collected using nLine’s PowerWatch devices.
- Original contracts signed between Kenya Power and contractors.
- Qualitative interviews: with senior leadership at Kenya Power, the WB, and the AfDB.
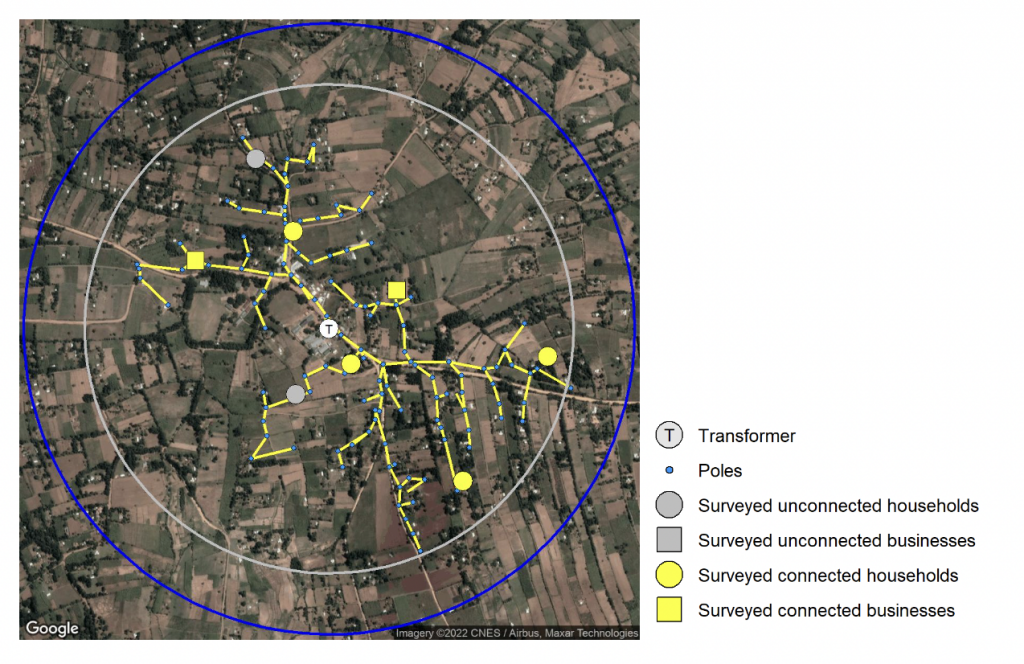
FIGURE 3: Example of a Last Mile Connectivity Project (LMCP) VillageEach LMCP site is centered around a transformer from which low-voltage wiring extends to connect households and businesses to the grid. The gray circle denotes the 600m eligibility radius and the blue circle denotes our 700m surveying threshold.
In addition to these primary data, we analyze 2009 Census data, VIIRS nighttime radiance data, land gradient data, and HERE Maps travel data.
Results
We identified three main results:
- Households in villages funded by the AfDB are connected to electricity on average 8 months sooner than households in villages funded by the WB. This delay is caused primarily by the increased bureaucratic requirements resulting from the larger number and heterogeneity in WB contracts, as well as poor coordination between the various stages of WB contracting.
- Second, more poles and household connections were constructed at AfDB sites, driven in part by the WB’s stricter adherence to the rule that only households within 600m of the transformer were to be connected.
- Third, WB processes, while taking longer, do generate tangible benefits: on-the-ground construction quality is 0.6 standard deviations higher at WB sites than AfDB sites, driven largely by the increased presence of pole caps, stays/struts, and grounding wires. While this does not lead to any improvements in voltage quality or power outages, these improvements are likely to improve grid longevity, lowering long-term maintenance and replacement costs.
We also found that the additional audit treatment improved construction quality at AfDB sites but not at WB sites, which already saw rigorous ex-post inspections. These results hold across three different outcomes: the audit treatment increases the number of poles constructed at AfDB sites (but not at WB sites), improves average voltage by 5V at AfDB sites (but not at WB sites), and improves household installation quality and electricity usage at AfDB sites (but not at WB sites). Taken together, these results suggest that the additional inspection prescribed by WB procedures has an important effect on construction quality.
Evaluating the relative net benefits of the two approaches requires understanding the long- and short-term costs and benefits: the WB procedures delayed the household connection date but reduced long-term maintenance costs when compared with AfDB procedures. We calculate that even a reasonable set of assumptions indicate anywhere from a USD 5.6mn net benefit of AfDB processes to a USD 2.8mn net benefit of WB processes. Neither method is necessarily the best option, and the optimal contracting structure will depend on the project’s goals. Governments looking to spur short-term electrification may prefer the bundled method used by AfDB, whereas governments prioritizing longer term trade-offs may want to employ the unbundled method used by WB.