


Data is often scarce when it relates to the development of electricity infrastructure in emerging economies. Using geographic information system (GIS) databases has become standard practice,1 but information digitization, data collection, and aggregation at scale can be costly and take years. Researchers are looking for clever solutions for instances where data is low quality or unavailable.
Nighttime lights (NTL) satellite imagery provides a unique perspective on human activity (Fig. 1). This data is particularly useful because it reflects consistent measurements, is often very low or no cost, and is globally available at relatively high temporal and spatial resolutions. NTL imagery has been applied to electricity sector challenges such as electrification access tracking, transmission and distribution line mapping, electricity reliability estimation, and electricity consumption assessments.
While NTLs offer exciting promise, they can be challenging to use and extracting their full potential is an open area of research.
NTLs can inform efforts to expand electricity access and build out infrastructure
NTLs promise significant value in terms of massively scaling analyses to areas that do not have information otherwise available. While model accuracies are not always high and sparse verification data poses an enduring challenge, NTLs help to:
- Estimate the extent of electrification in low-access countries. Determining where electricity supplies are and where they do not yet exist helps avoid planning redundant infrastructure. A number of studies show electrification status estimation at the village2 and grid cell-levels.3
- Estimate the locations of transmission and MV distribution power lines. Such characterizations at this scale are necessary inputs for large-scale electrification planning tools.4
- Indicate grid reliability. Even where buildings are supplied electric power in low-access countries, they are subject to power disruptions and poor reliability. Processed daily NTL imagery can help detect outages and estimate grid reliability.5
- Electricity consumption estimation.6 Forecasting electricity consumption and demand is important for planning infrastructure. Overbuilt infrastructure implies wasted resources with high opportunity cost while underbuilding yields outages and forgone economies of scale.
Combining NTL images with other data sets in creative ways offers enhanced value
New research focuses on extracting value out of NTL images in non-traditional ways:
- High-res poverty maps via “transfer learning.” Most traditional approaches to employing NTLs in analysis use image pixel values directly, but there is also synergistic value in creatively combining NTL and high-res daytime satellite images. Jean et al.7 exemplify this by training neural network models to estimate NTL values as output, then rearranging model representations to estimate economic well-being in five African countries. These “transfer learning” procedures can significantly outperform models using NTL values alone.
- Probabilistic data fusion. Investment decisions may look very different depending on whether information uncertainty is high or low. Dean et al.8 incorporate NTL pixel values, building density information, and power transformer location and density data to provide probabilistic estimates of electrification status using a “lightweight data fusion” model. Future work with NTL-informed probabilistic representations of electricity supply and demand promise to improve investment efficiencies in the sector.
But… different NTL datasets exist and working with them can be a headache
There are at least seven NTL datasets and several subsets from different satellites, with varying characteristics.9 Four can be accessed for free: the Defense Meteorological Program Operational Line-Scan System (DMSP-OLS),10 Suomi National Polar-Orbiting Partnership Visible Infrared Imaging Radiometer Suite (VIIRS),11 International Space Station (ISS),12 and Luojia1-01 (LJ1-01)13 datasets. DMSP-OLS and VIIRS are the most popular for electrification applications because they have the longest time series, consistent global coverage, and acquire data nightly. There are, however, important considerations, including:
- Inconsistent spatial resolutions. Images taken with different spatial resolutions can be challenging to integrate. DMSP-OLS is available at 30 arc-second spatial resolution (roughly 1 km at the equator), VIIRS at 15 arc-second resolution (roughly 0.5 km at the equator), ISS from 5 to 200 m resolution, and LJ1-01 at 130 m resolution.
- Differing temporal resolutions. Daily, monthly composite, and annual composite images are available for the DMSP-OLS and VIIRS datasets, while ISS images are irregular, and LJ1-01 images have 15-day intervals.
- Differing time periods. Researchers often track human activity and infrastructure over time, which requires consistent observations from sensors with similar measurement attributes. This is challenging with datasets available for different time periods: DMSP-OLS from 1992-2013, VIIRS from 2012-present, ISS from 2003-present, and LJ1-01 from 2018-present.
- Sensors only measure NTLs for a given location once per night, and regions have different satellite overpass times. The presence or absence of lighting (e.g., from phenomena such as power outages, etc.) can only be detected at the moment measurements are taken. DMSP-OLS overpass times were typically between 8 – 10 PM local time, while the times for VIIRS are often around 1 or 2 AM.
- Regions have different zenith angles over time. Satellite zenith angles affect radiance measurements and represent the angle at which imaging satellites reside in the sky.
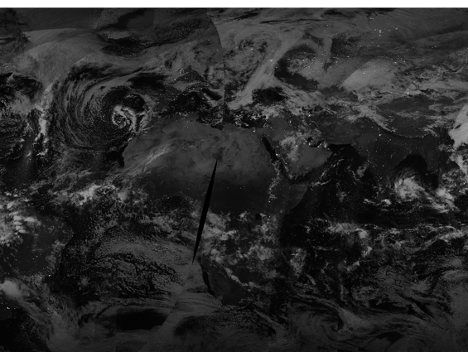
- Noisy images. Clouds, moonlight, stray light, and missing data can obstruct daily images. Fig. 3. shows an example of this in a daily VIIRS image.
- Saturation and blooming effects. Saturation occurs when sensor attributes cause the same measurement to be assigned to all luminance values past a threshold. Blooming relates to high luminance sensor measurements overflowing into neighboring pixels. DMSP-OLS has both saturation and blooming effects, as shown in Fig. 2. They are less prevalent in VIIRS imagery due to improved sensor capabilities.
- Lighting below satellite detection limits is not measured. NTLs record light from only a subset of electricity consumption. Low-level or occluded street lighting, indoor consumption, and other productive uses of electricity are not measured.
NTLs hold substantial promise for global analysis of energy infrastructure because of their universal coverage, relatively high spatial and temporal resolution, and easy interpretability. At the same time, NTLs can be prone to noise and are only a proxy measurement for overall electricity and economic attributes. It can also be challenging to apply NTLs to models with sparse verification data. Using NTL datasets responsibly requires understanding of these strengths and limitations.
FIGURE 1: Example NTL image from the DMSP-OLS dataset after annual composite and stable lights processing.
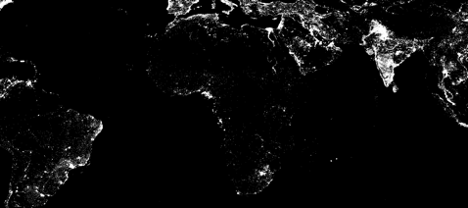
FIGURE 2: Saturation and blooming effects in the DMSP-OLS data set are made evident when comparing DMSP-OLS (left) and VIIRS (right) composites.
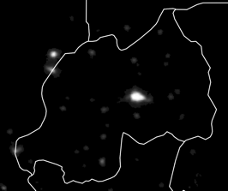
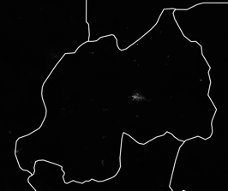
FIGURE 3: Cloud coverage and missing measurements exist when using unprocessed raw imagery.
Endnotes
- Independent Evaluation Group. Reliable and Affordable Off-Grid Electricity Services for the Poor: Lessons from the World Bank Group Experience. Technical report, World Bank, Washington, DC, 2016.
- Notable electrification status estimation studies at the village-level include: Min, B., Gaba, K.M., Sarr, O.F. and Agalassou, A., 2013. Detection of rural electrification in Africa using DMSP-OLS night lights imagery. International Journal of Remote Sensing, 34(22), pp.8118-8141.; and Min, B. and Gaba, K.M., 2014. Tracking electrification in Vietnam using nighttime lights. Remote Sensing, 6(10), pp.9511-9529.
- Notable electrification status estimation studies at the grid cell-level include: Andrade-Pacheco, R., Savory, D.J., Midekisa, A., Gething, P.W., Sturrock, H.J. and Bennett, A., 2019. Household electricity access in Africa (2000–2013): Closing information gaps with model-based geostatistics. PLOS One, 14(5); Falchetta, G., Pachauri, S., Byers, E., Danylo, O. and Parkinson, S.C., 2020. Satellite Observations Reveal Inequalities in the Progress and Effectiveness of Recent Electrification in Sub-Saharan Africa. One Earth.; Lee, S.J., 2018. Adaptive electricity access planning, Massachusetts Institute of Technology.
- Ciller, P., Ellman, D., Vergara, C., González-García, A., Lee, S.J., Drouin, C., Brusnahan, M., Borofsky, Y., Mateo, C., Amatya, R., Palacios, R., Stoner, R., de Cuadra, F., Perez-Arriaga, I., 2019. Optimal electrification planning incorporating on-and off-grid technologies: the Reference Electrification Model (REM). Proceedings of the IEEE, 107(9), pp.1872-1905.
- Mann, M.; Eli, M.; Arun, M. Using VIIRS day/night band to measure electricity supply reliability: Preliminary results from Maharashtra, India. Remote Sens. 2016, 8, 711. ; Min, B.; O’Kee, Z.; Zhang, F. Whose Power Gets Cut? Using High.-Frequency Satellite Images to Measure Power Supply Irregularity; Policy Research Working Paper No. WPS 8131, World Bank Group: Washington, DC, USA, 2017 ; Elvidge, C.D., Hsu, F.C., Zhizhin, M., Ghosh, T., Taneja, J. and Bazilian, M., 2020. Indicators of Electric Power Instability from Satellite Observed Nighttime Lights. Remote Sensing, 12(19), p.3194. ; Shah, Z., Hsu, F.C., Elvidge, C.D. and Taneja, J., Mapping Disasters & Tracking Recovery in Conflict Zones Using Nighttime Lights ; Cao, C., Shao, X. and Uprety, S., 2013. Detecting light outages after severe storms using the S-NPP/VIIRS day/night band radiances. IEEE Geoscience and Remote Sensing Letters, 10(6), pp.1582-1586.
- Amaral, S., Câmara, G., Monteiro, A.M.V., Quintanilha, J.A. and Elvidge, C.D., 2005. Estimating population and energy consumption in Brazilian Amazonia using DMSP night-time satellite data. Computers, Environment and Urban Systems, 29(2), pp.179-195. ; Chand, T.K., Badarinath, K.V.S., Elvidge, C.D. and Tuttle, B.T., 2009. Spatial characterization of electrical power consumption patterns over India using temporal DMSP‐OLS night‐time satellite data. International Journal of Remote Sensing, 30(3), pp.647-661.; Tripathy, B.R., Sajjad, H., Elvidge, C.D., Ting, Y., Pandey, P.C., Rani, M. and Kumar, P., 2018. Modeling of electric demand for sustainable energy and management in India using spatio-temporal DMSP-OLS night-time data. Environmental management, 61(4), pp.615-623.
- Jean, N., Burke, M., Xie, M., Davis, W.M., Lobell, D.B. and Ermon, S., 2016. Combining satellite imagery and machine learning to predict poverty. Science, 353(6301), pp.790-794.
- Dean, C.L., Lee, S.J., Pacheco, J. and Fisher III, J.W., 2020. Lightweight Data Fusion with Conjugate Mappings. arXiv preprint arXiv:2011.10607.
- NTL datasets include DMSP-OLS, VIIRS, ISS, EROS-B, JL1-3B, JL1-07/08, and LJ1-01. Their characteristics are summarized in: Zhao, M., Zhou, Y., Li, X., Cao, W., He, C., Yu, B., Li, X., Elvidge, C.D., Cheng, W. and Zhou, C., 2019. Applications of satellite remote sensing of nighttime light observations: Advances, challenges, and perspectives. Remote Sensing, 11(17).
- DMSP-OLS data can be downloaded from https://www.ngdc.noaa.gov/eog/download.html and https://registry.opendata.aws/wb-light-every-night/ .
- VIIRS data can be downloaded from https://www.ngdc.noaa.gov/eog/download.html, https://ladsweb.modaps.eosdis.nasa.gov/, and https://registry.opendata.aws/wb-light-every-night/ .
- ISS data can be downloaded from http://eol.jsc.nasa.gov/ , and https://citiesatnight.org/ .
- LJ1-01 data can be downloaded from http://59.175.109.173:8888/app/login.html .