

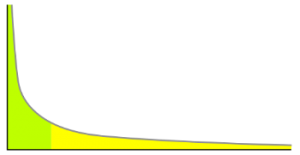
What do earthquake magnitudes, viral YouTube videos, and consumer-level electricity demand have in common? If you guessed: “they all exhibit long-tailed distributions,” you’re correct! ‘Long-tailed’ distributions refer to those in which a small number of occurrences take extreme values, far from the central part of the distribution. This means that while most earthquakes are relatively weak, a few do occur that are orders of magnitude more intense and destructive. Analogously, while most electricity users consume relatively modest amounts of power, a small number consume at profoundly higher levels.
Energy systems models often ignore this heterogeneity across consumer types. They commonly assume homogeneous demand within an area of interest: all buildings are erroneously assumed to reflect a single average consumer type with a single common level of demand. This is analogous to a real estate developer constructing a building in an earthquake-prone area but only making sure it can withstand an average number of average strength earthquakes! Because the largest quakes confer disproportionate risk, the developer would obviously do better to consider the whole long-tailed distribution of earthquake magnitudes. Similarly, energy modelers must account for diverse consumers, because they can have an enormous impact on power systems – particularly in countries with low levels of access and reliability.
‘Long-tailed’ puts it lightly: while few in number, commercial and industrial consumers are paramount.
It is hard to overstate how extreme the long-tails on electricity consumption distributions are in low-access and low-reliability countries. The largest consumers are relatively few and massive.
- In Kenya, commercial and industrial consumers comprise 0.04% of all consumers but make up 52.78% of all demand.1 Put another way: over half of electricity demand in Kenya comes from one in over two thousand consumers. The statistics are similar in Uganda and elsewhere in Africa.2
- The long tails on electricity consumption distributions dwarf others we may be more familiar with. As a reference point: during the U.S.’s 2011 Occupy Wall Street protests, which were partly motivated by economic inequality, 1% of American households owned 34.6% of the country’s private wealth.3 The long tail of electricity consumption in Kenya is two orders of magnitude more extreme.
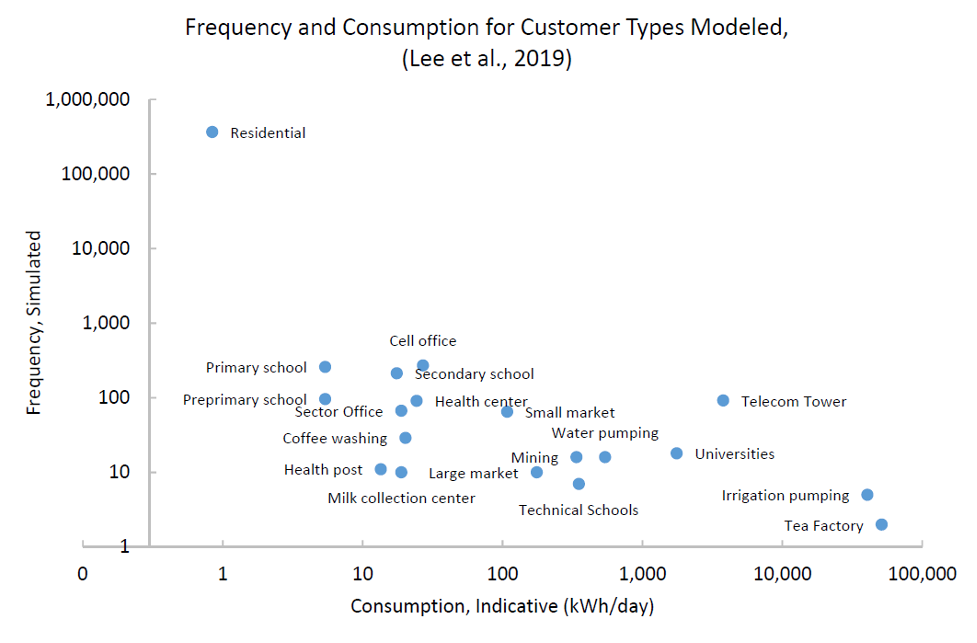
- Utility data puts the long tail in perspective. Figure 1 reflects 20 indicative East African consumer types and demonstrates how some consumer types demand significantly higher energy consumption than others. For instance, an average tea factory can consume over 60,000 times more electricity than an average residential consumer.
FIGURE 1: Representations of demand for indicative consumer types show how their relative frequencies and consumption values can span up to five orders of magnitude. (log scale)4
A micro-level view of electrification planning: failing to account for the long tail results in inefficient and financially unsustainable electricity systems.
Figure 2 presents a simple thought experiment illustrating the distortive effects of modeling homogeneous demand when consumption otherwise follows a heterogeneous, long-tailed distribution. Each scenario models three communities (each a “consumer”) totaling the same aggregate electricity demand (12 units). The scenario depicted in the left column correctly represents consumers reflecting demand heterogeneity: one consumer has significantly higher demand (10 units) than the others (each with one unit). The scenario in the right column makes the incorrect assumption of modeling homogeneous demand: each consumer demands the same amount of electricity. To prescribe electrification modes, we apply a rule that all communities with over two units of demand will be supplied via grid extension, and communities with two units or fewer will be supplied with off-grid solutions.
FIGURE 2: Thought experiment illustrating the outcomes of modeling heterogeneous vs. homogeneous electricity demand.
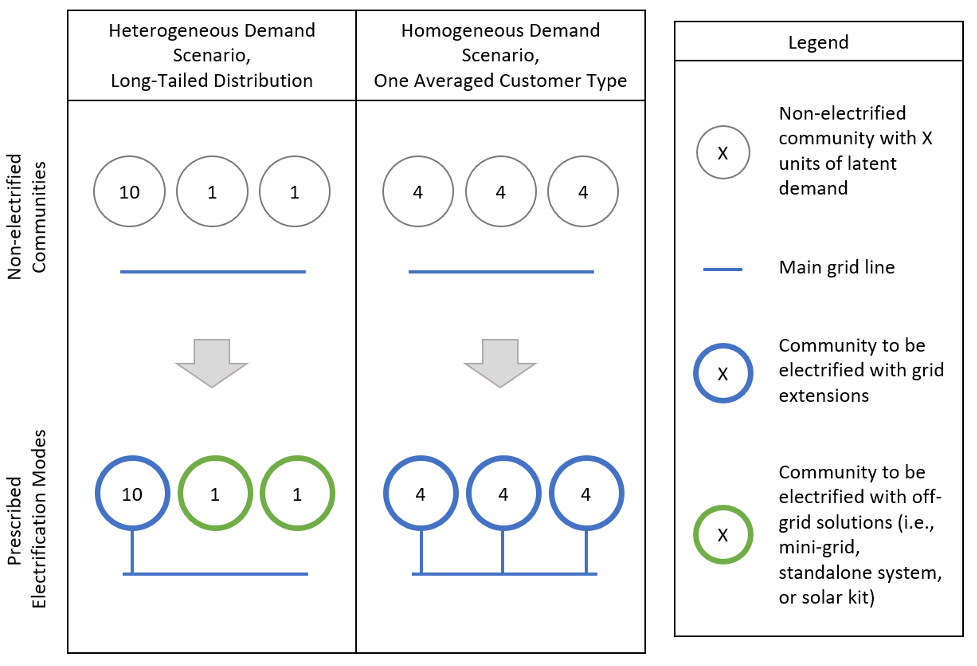
- Modeling long-tailed distributions reveals added value from off-grid solutions. The two scenarios total the same aggregate value of electricity demand, but prescribe very different electrification strategies. The heterogeneous demand scenario (reflecting the long tail of electricity consumers) prescribes off-grid electrification modes for two of three communities. In contrast, the homogeneous demand scenario prescribes no off-grid systems and thus overstates the need for grid extensions.
- Accounting for the ‘long tail’ suggests opportunities for cost efficiencies and improved service quality. While both scenarios electrify all consumers, the heterogeneous demand scenario is more efficient because it allows grid infrastructure to be focused on serving a single high-demand customer, and provides the other customers with off-grid solutions that are both cheaper and more quickly deployed. In contrast, the homogeneous demand scenario builds out costly grid infrastructure for each customer. This over-invests in customers better served by off-grid sources, and under-invests in the high-demand customer, who may require costly upgrades to ensure reliable and quality supply. Optimizing these costs is especially important in highly resource-constrained environments.
- Real numbers show real value. Connections made via grid extension and connections made via mini-grid and standalone systems can have major cost differences. This is especially true in sub-Saharan Africa, where 63% of the population resides in rural areas. Because of long distances between villages, main grid connections often necessitate the construction of long transmission lines and typically run around $2,500 per household. By contrast, mini-grids don’t require long interconnections, and connection costs average less than $1,300 per household. Standalone systems (i.e. solar home systems) are even cheaper because they avoid the need for distribution lines as well. The cheapest standalone system units cost less than $80.5 Overemphasizing the need for grid extension can lead to a misallocation of scarce resources.
A macro-level view of electrification planning: accurately characterizing the long tail of large consumers ensures the financial health of electricity systems.
So how can we accommodate this long tail when planning electricity systems? A recent study on building-level electrification planning shows that modeling the long tail of large consumers has significant implications for prescribed designs.6 The study analyzes the costs of electrifying over 365K consumers for an indicative region in Uganda and supports the following conclusions:
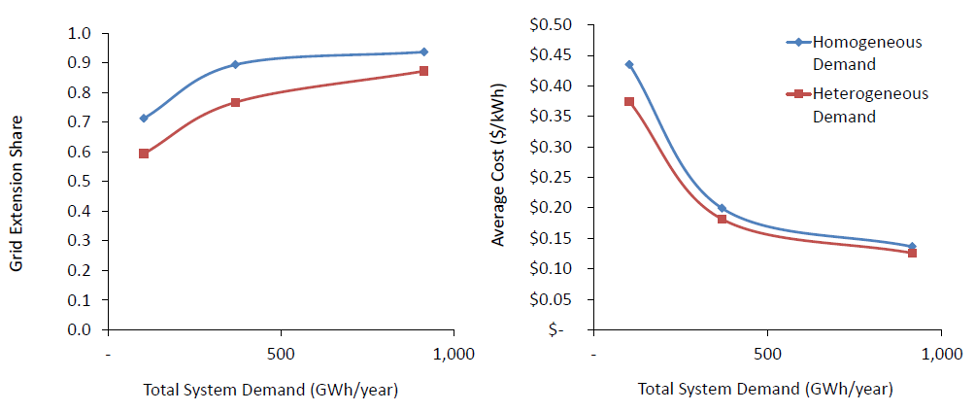
- The long tail underscores the need for more mini-grids and standalone systems. Modeling demand heterogeneity decreases prescribed grid extension shares from 89% to 77%, connoting an increase in the prevalence of mini-grid and stand-alone systems. These results can be observed by comparing the middle demand points in the left plot of Figure 3.
- Accounting for the long tail can also reveal lower-cost designs. In the study, modeling demand heterogeneity results in least-cost plans that are 9% cheaper than those produced by models assuming one single consumer type. These results can be seen by comparing the middle demand points in the right plot of Figure 3.
- Large consumers comprising the long tail bring outsized benefit to the financial health of electricity systems. The right plot of Figure 3 also illustrates strong economies of scale corresponding to total system demand. As total system demand rises, per-kWh costs decrease for all consumers on average. Because the long tail of large consumers comprises a substantial share of total system demand, it is evident that each large consumer confers outsized benefit to the overall electricity system.
FIGURE 3: A building-level optimization model shows how accounting for the long tail of large consumers via modeling “heterogeneous demand” can reflect lower shares of grid extension (i.e., higher shares of mini-grid and standalone systems) (left) and decreased costs (right) across different levels of total system demand.
Conclusion
Understanding and accounting for the ‘long tail’ of large consumers plays a critical role in both electrification planning and in policy and regulation. The long tail in low-access countries or regions is longer than some might assume, and these long tails can have significant implications for infrastructure designs, electrification costs, and ultimately service quality. Failing to characterize and model the long tail of large consumers can result in inefficient and financially unsustainable electricity systems. Because relatively few long tail consumers often make up a substantial fraction of total electricity system demand, they effectuate economies of scale and bring outsized benefit to the financial health of the entire sector. Nurturing the long tail of electricity consumers is crucial for achieving energy sector goals, including the UN’s Sustainable Development Goal 7 and the Energy for Growth Hub’s “Modern Energy Minimum.”7,8 Understanding the impact of the long tail of large consumers on the grid is an area of research that deserves more attention.
Endnotes
- Statistics computed from: The Kenya Power and Lighting Company PLC, 2021. Annual Report and Financial Statements for the Year Ended 30th June 2021.
- In Uganda, 3472 industrial consumers, representing 0.23% of all consumers, comprise 67.65% of all demand. Umeme, 2020. Electricity Distribution for a Better Uganda: Annual Report 2020.
- Wolchover N., 2011. 5 Facts about the Wealthiest 1 Percent, Live Science
- This figure is driven by data from the simulated case study described in the following reference: Lee, S.J., Sánchez Jacob, E., González García, A., Ciller Cutillas, P., Dueñas Martínez, P., Taneja, J., Cuadra García, F., Lumbreras Martín, J., Daly, H., Stoner, R.J. and Pérez Arriaga, I.J, 2019. Investigating the Necessity of Demand Characterization and Stimulation for Geospatial Electrification Planning in Developing Countries, MIT Center for Energy and Environmental Policy Research. Customer types are modeled by combining a number of different data sources, including a data set associated with the Rwandan Electrification Master Plan: REG, 2019., The National Electrification Plan: Report on definition of technologies (On-grid and off-grid) at village level.
- AECF and ENEA Consulting, 2020. Scaling-Up Mini-Grids For Rural Electrification: Lessons from AECF’s project portfolio.
- The results in this section and the plots in Figure 2 are taken with permission from: Lee, S.J., Sánchez Jacob, E., González García, A., Ciller Cutillas, P., Dueñas Martínez, P., Taneja, J., Cuadra García, F., Lumbreras Martín, J., Daly, H., Stoner, R.J. and Pérez Arriaga, I.J, 2019. Investigating the Necessity of Demand Characterization and Stimulation for Geospatial Electrification Planning in Developing Countries, MIT Center for Energy and Environmental Policy Research. The study originally appeared in a spotlight article in the IEA’s World Energy Outlook 2018: IEA, 2018. World Energy Outlook 2018, IEA, Paris https://www.iea.org/reports/world-energy-outlook-2018
- U.N. Department of Economic and Social Affairs, 2016. Transforming our world: The 2030 agenda for sustainable development.
- Moss, T., Bazilian, M., Blimpo, M., Culver, L., Kincer, J., Mahadavan, M., Modi, V., Muhwezi, B., Mutiso, R., Sivaram, V. and Taneja, J., 2020. The Modern Energy Minimum: The case for a new global electricity consumption threshold. Energy for Growth Hub.