

Over the last two decades, the combined cycle gas turbine (CCGT) has become the dominant technology for gas-fired power due to its high efficiency, low operating costs, and low emissions. In lower-income countries, however, project development and operating environments can make the open cycle gas turbine (OCGT) a more affordable option – and more compatible with a high-renewables future.
Open cycle vs. combined cycle gas turbines
An open cycle gas turbine compresses air, burns it with gaseous fuel, and expands the resulting gas through a turbine to extract energy in the form of electricity.1 (A jet engine works in the same way, except it uses the energy to create thrust.) A combined cycle gas turbine starts with an OCGT and adds a “bottoming cycle” that uses the exhaust heat from the gas turbine to make steam that expands through another turbine to generate additional electricity. This additional cycle makes CCGTs more expensive to build, but also more efficient at converting the energy content of the gas to electricity. This gives CCGT’s lower operating costs and greenhouse gas (GHG) emissions per megawatt-hour (MWh) of electricity produced.
The rise of combined cycle gas turbines in rich countries…
The efficiency of CCGTs has made them a mainstay of generation fleets in the US, UK, and other countries. The United States has added 267 GW of CCGT capacity since 2000, with CCGTs now representing 56% of gas-fired generating capacity (vs. 28% for OCGTs).2 In the US, gas is displacing coal, which has led to an increase in the average CCGT capacity factor from about 35% in 2005 to about 60% today.3 CCGTs now provide baseload power in much of the country, while OCGTs provide “peaking” power during the limited number of hours in which demand is particularly high.
Project development challenges in lower-income countries
It might seem obvious that energy-poor countries planning a role for gas-fired generation should follow in the footsteps of rich countries and build out significant CCGT capacity. But the project development environment in these countries presents two challenges that negatively affect CCGTs more than OCGTs:
- High capital costs (and cost of capital). Development and construction timelines can be 2-3x longer than those in mature project development environments, inflating capital costs. Risky investment climates also raise the cost of capital, requiring project developers to procure credit enhancement products, such as Partial Risk Guarantees (PRGs) from the World Bank or other multilateral finance institutions.
- Low capacity factors. Power plants in lower-income countries often run less of the time due to fuel shortages and/or electricity grid challenges. In Nigeria, for example, power plants are frequently curtailed due to vandalization of gas pipelines and lack of transmission capacity to absorb the electricity generated.
The CCGT has higher capital costs and lower operating costs than the OCGT. To beat out the OCGT economically, it has to run enough of the time that its operating cost advantage overcomes its capital cost disadvantage. In an adverse project development environment where capital costs are higher, the absolute gap in capital expenditures between the CCGT and OCGT increases. And lower capacity factors mean fewer operating hours in which the CCGT can recover its higher capital costs.
Levelized Cost of Energy (LCOE) for CCGT vs. OCGT
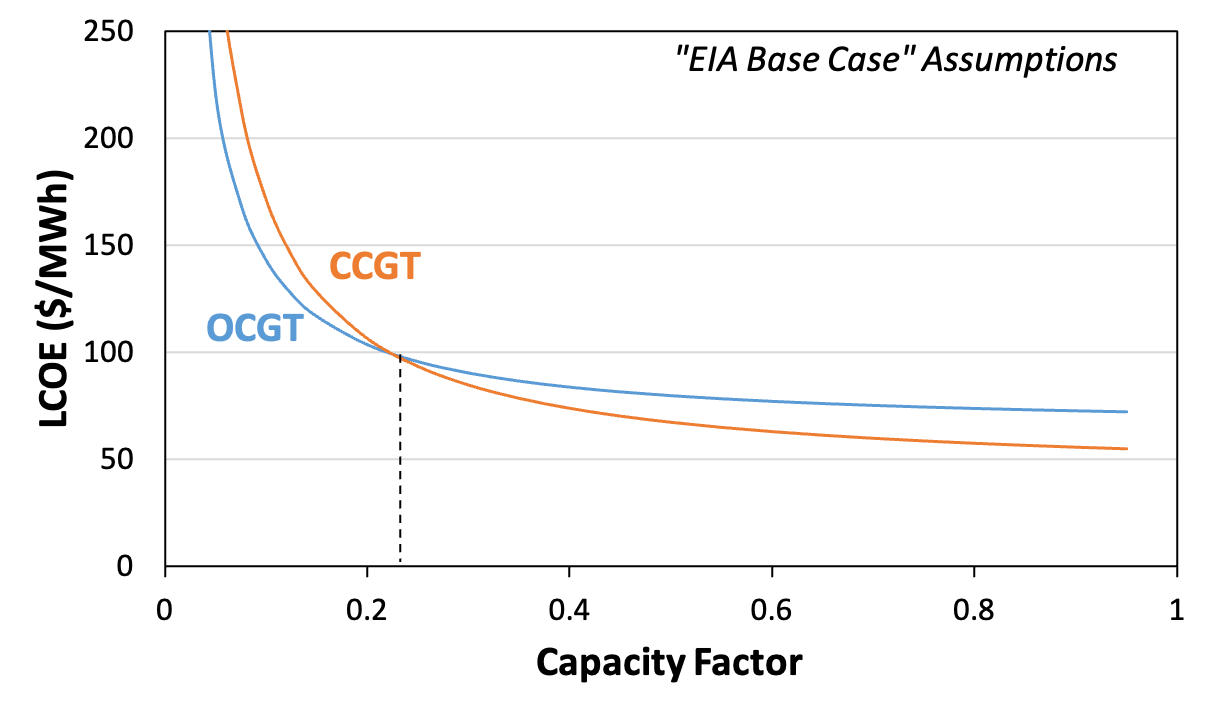
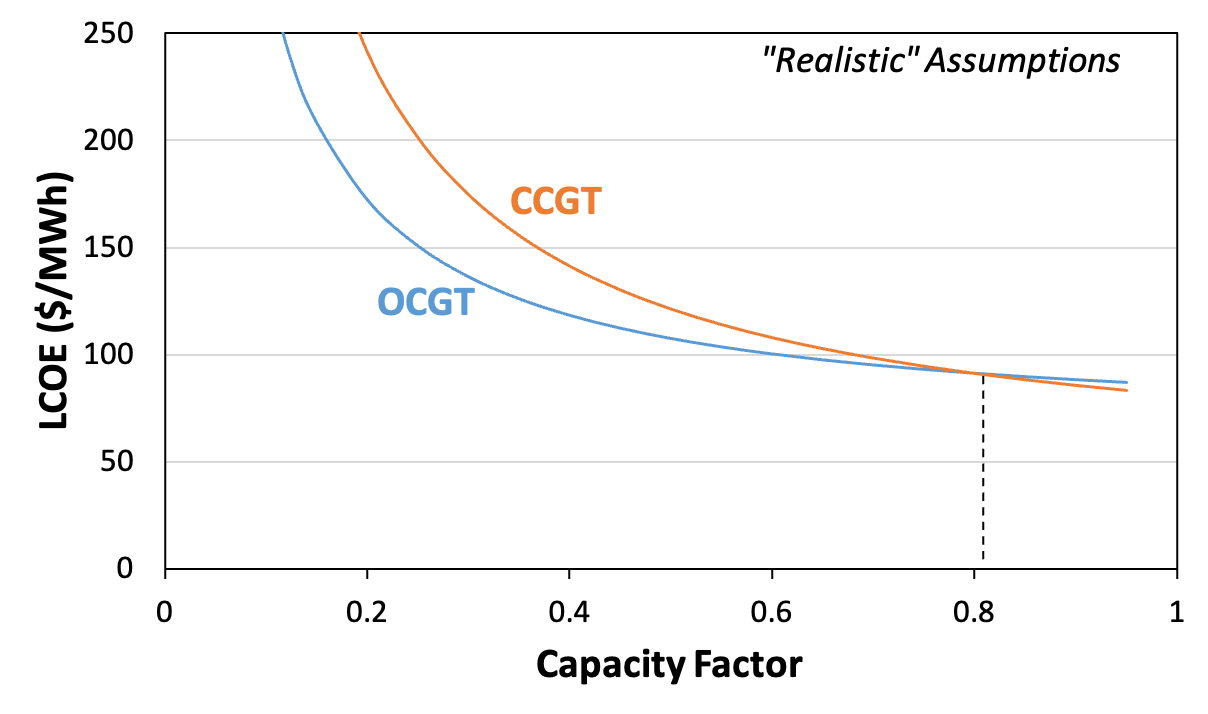
To examine the CCGT vs. OCGT choice in lower-income countries, we model the Levelized Cost of Energy (LCOE) for both technologies as a function of capacity factor. In Figure 1, we use the base power plant assumptions and a cost of capital of 5% from the US Energy Information Administration (EIA). In Figure 2, we double capital costs, construction times, and cost of capital to simulate more adverse conditions in emerging markets. For example, the EIA assumes an overnight capital cost of $709/kW and a construction time of 2 years for a 237-MW OCGT.4 Actual capital cost and construction times of recent OCGT projects in West Africa have run higher than these figures by a factor of two or more.
In the low-risk project development environment (Figure 1), CCGT dominates on cost for all but the lowest capacity factors, at which the lower capital cost requirements of OCGT make it superior. In the high-risk project development environment (Figure 2), OCGT is the least-cost technology except at capacity factors above 80%, which are not generally observed for gas-fired generators in any geography. In other words, when you take into account the higher capital costs, higher cost of capital, and longer timelines that are typical for lower-income countries, the CCGT’s advantage in operating costs is not enough to offset its capital cost disadvantage—even if it were able to operate at a high capacity factor (i.e., in “baseload mode”). Realistically, constraints on gas availability and electricity grids are likely to yield average capacity factors far lower than the 60% currently observed in the United States, making the advantage of OCGTs even more significant.
FIGURE: LCOE estimates for OCGT and CCGT as a function of capacity factor5
1: “EIA Base Case” cost assumptions, cost of capital of 5%, and $6/MMBtu gas. 2: 2X higher capital cost and construction times, cost of capital of 10%, and $6/MMBtu gas.
Emissions implications of OCGTs
International development partners (who help finance many of these projects) may prefer CCGTs to OCGTs because of their lower emissions per megawatt-hour of electricity generated. A modern CCGT emits about 0.34 tonnes of CO2 per MWh of electricity, compared with 0.52 tonnes of CO2 per MWh for an OCGT.6 But the logic of comparing emissions rates presupposes that these two technologies will be used in an identical way—namely, as baseload generators intended to produce as many megawatt-hours of electricity as possible.
As more and more electricity around the world is generated from intermittent renewable sources like wind and solar, the role of gas-fired generation will increasingly be to provide reliability services rather than bulk electricity. While the average capacity factor of CCGTs in the US is 60%, California has a lower figure of around 40%, in significant part because of its high share of wind and solar. If California achieves its aggressive targets of 50% renewable generation by 2026 and 60% renewable generation by 2030, the capacity factors of gas-fired generation are likely to drop into the range where new OCGTs would be economically preferable to new CCGTs (see Figure 1).
The short payback times of OCGTs make them ideal “bridge generators” to back up renewables until lower-carbon options are viable.7 OCGTs produce about 50% higher emissions per megawatt-hour than CCGTs, but their economic model allows them to run fewer hours—and over fewer years. The environmental risk of building CCGTs, by contrast, is that they will need to be operated longer and more often to recover their higher fixed costs, negating any emissions benefits from their lower emissions rates.
In the context of lower-income countries, OCGTs are both more affordable and more consistent with a long-term, high-renewables vision in which gas-fired generators provide backup for wind and solar rather than baseload electricity. This is a case where “leapfrogging” might mean choosing a less efficient technology for gas-fired generation: the open cycle gas turbine.
Endnotes
- Open cycle gas turbines are also referred to as simple cycle gas turbines, gas turbines, combustion turbines, and gas speakers.
- US Energy Information Administration, “Form EIA-860 detailed data with previous form data (EIA-860A/860B),” September 9, 2021, https://www.eia.gov/electricity/data/eia860/
- US Energy Information Administration, “Average utilization for natural gas combined-cycle plants exceed coal plants in 2015,” April 4, 2016, https://www.eia.gov/todayinenergy/detail.php?id=25652; US Energy Information Administration, “Natural gas combined-cycle plant use varies by region and age,” May 20, 2021, https://www.eia.gov/todayinenergy/detail.php?id=48036
- From US EIA, “Cost and performance characteristics of new generating technologies, Annual Energy Outlook 2021,” February 6, 2021, https://www.eia.gov/outlooks/aeo/assumptions/pdf/table_8.2.pdf. The EIA’s figures for a 418-MW CCGT are $1,082/kW and 3 years. The EIA assumes a heat rate of 6,431 Btu/kWh for the CCGT, versus 9,905 Btu/kWh for the 237-MW OCGT.
- Figures 1 and 2 both assume a delivered gas price of $6/MMBtu, which we consider broadly reasonable for facilities in lower-income countries in gas-rich regions.
- These figures are based on the US EPA’s carbon content estimate of 14.43 kg C/MMBtu for pipeline gas (https://www.epa.gov/energy/greenhouse-gases-equivalencies-calculator-calculations-and-references) and assume heat rates of 6.431 MMBtu/MWh for CCGT and 9.905 MMBtu/MWh for OCGT per EIA estimates (https://www.eia.gov/outlooks/aeo/assumptions/pdf/table_8.2.pdf).
- Rexon Carvalho, Eric Hittinger, and Eric Williams, “Payback of natural gas turbines: A retrospective analysis with implications for decarbonizing grids,” Utilities Policy 73, December 2021.