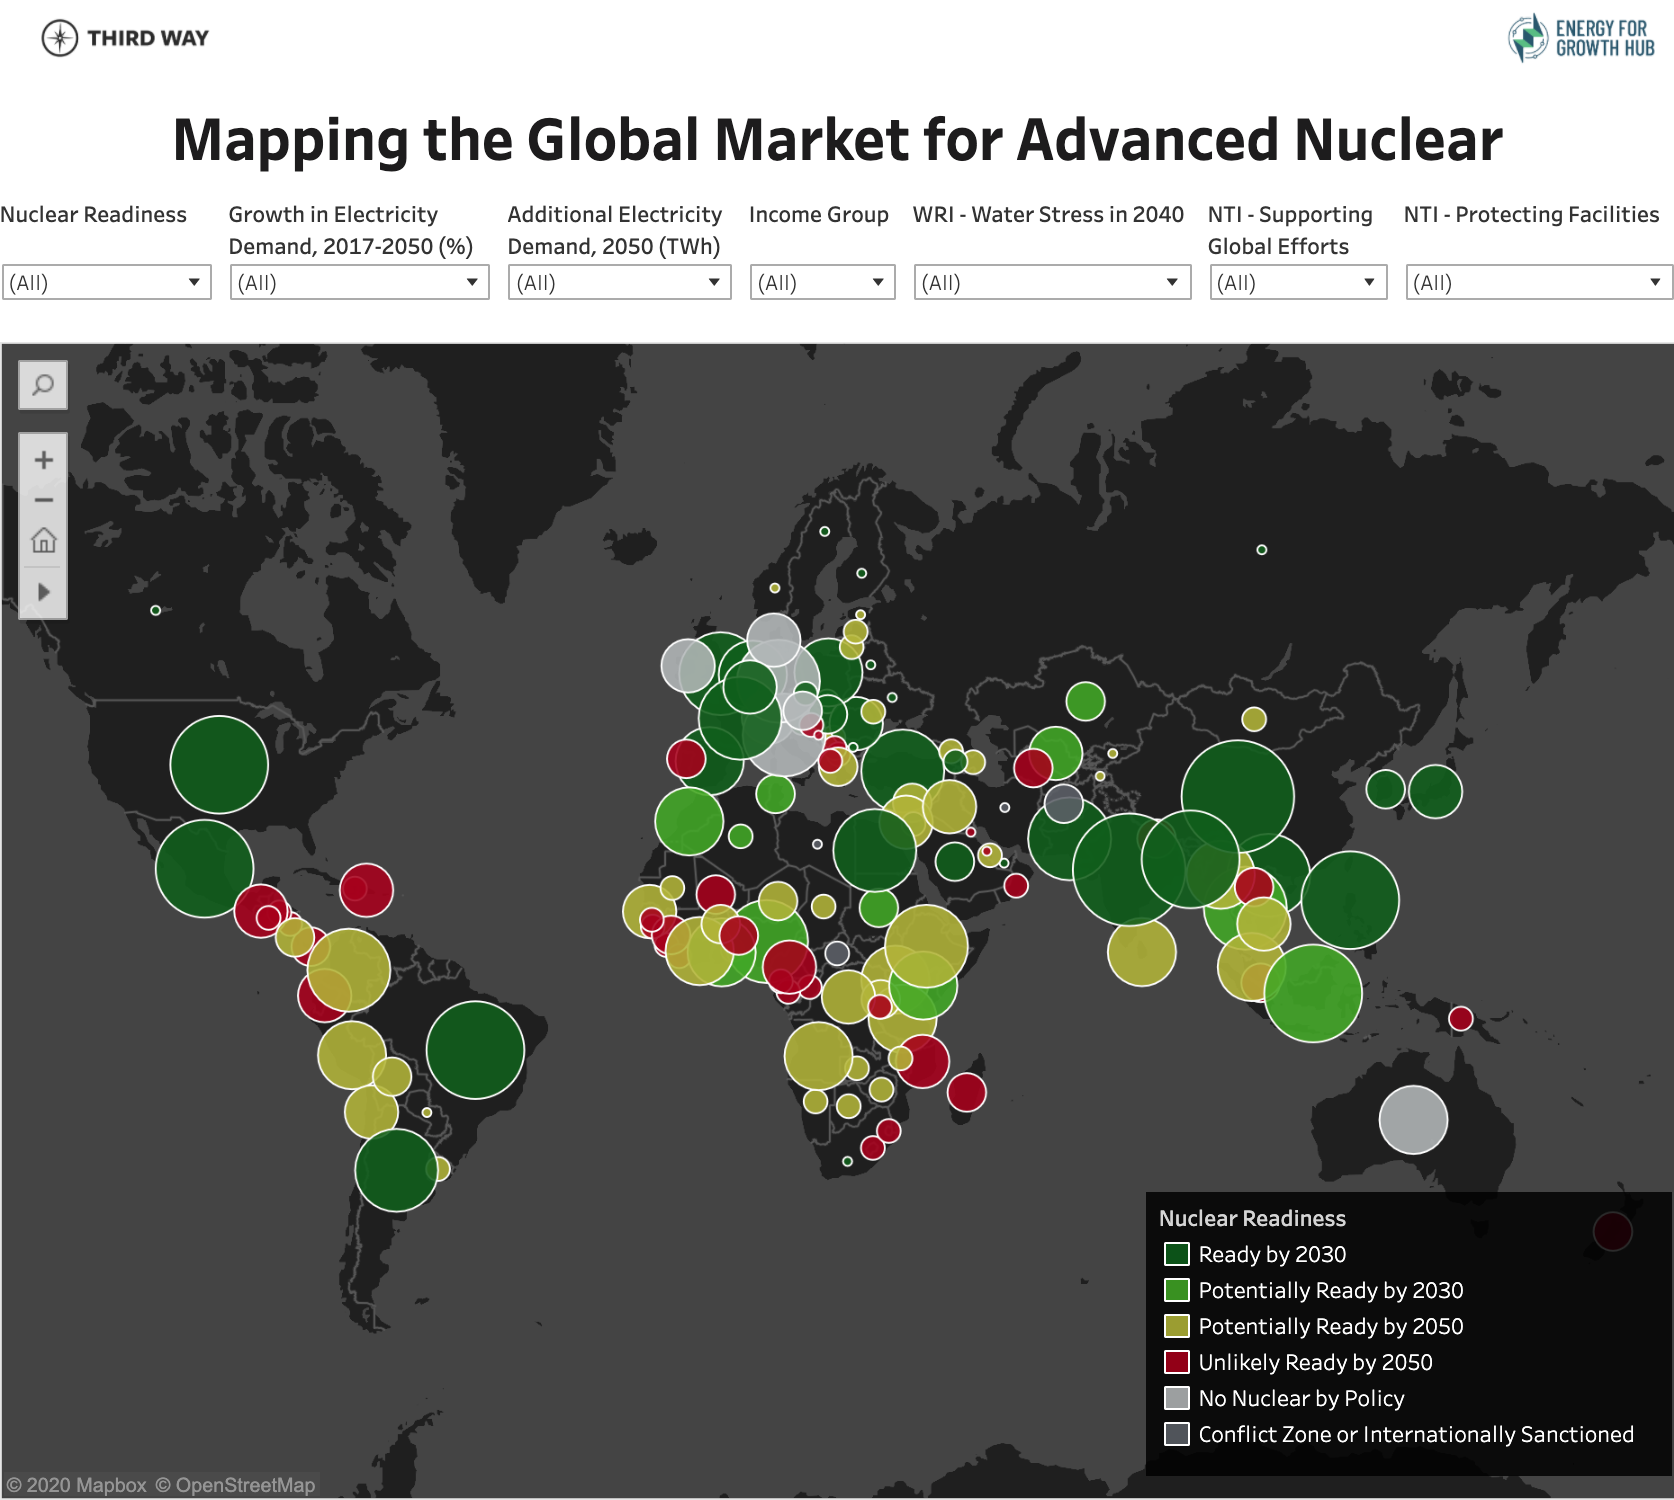
The Hub and Third Way collaborated to create a new interactive map that provides a first-of-a-kind ‘nuclear readiness’ assessment and electricity demand projections in 2050 for 148 countries. The map, found here, has two indicators that give an idea of the potential market scale for advanced nuclear power:
- Electricity Demand Gap in 2050. The size of the circles of the map display the projected additional electricity demand over the next 3 decades.
- Nuclear Readiness Score. The color (green-yellow-red) corresponds to the assessed readiness of a country based on a 10-point checklist.
More information on the projection and scoring methodology is here. The Checklist and Demand Projection data can be found here.
The map also includes contextual data that can be filtered:
- The World Bank’s income groupings. Low, lower-middle, upper-middle, and high, based on GNI per capita (US$ Atlas method).
- The World Resources Institute’s projected water stress ratings in 2040. Nuclear powered desalination could play a role in addressing the growing demand for potable water and provide an option for areas with acute water shortages.
- The 2020 NTI Nuclear Security Index ratings that assess actions related to supporting global nuclear security efforts.
- The 2020 NTI Nuclear Security Index rankings of 46 countries with nuclear facilities to assess actions to protect those facilities against sabotage.
In 2021, we added data for four new demand drivers in 12 focus countries:
- Desalination is at the heart of the energy-water nexus, and could grow dramatically in a water-stressed world. Economically running desalination plants requires large quantities of consistent (and cheap) power supply, making nuclear power well-suited.
- Industrial non-electric energy. There is significant energy consumed in the industrial sector outside of direct electricity inputs. This will be one of the most difficult sectors to decarbonize as large quantities of energy are needed for industrial heating and other activities. Globally, industrial energy is equal to about a third of total electricity used in an economy. By projecting this ratio forward, we can estimate the total industrial energy that will need to be electrified or otherwise decarbonized by 2050.
- Coal Replacement. As a source of firm, clean power, nuclear plants are excellent candidates for direct replacement of existing coal facilities. Our model projects additional electricity demand, but doesn’t account for the potential to outright replace existing high-carbon assets such as coal plants. This is particularly relevant in countries like South Africa where electricity demand isn’t expected to grow, but nearly all of the existing assets will need to be replaced in order to reach net zero.
- Electric Vehicles. While EVs don’t have unique relevance to nuclear power, they represent a potentially significant new source of electricity demand. We calculated projected demand in our focus countries under a net zero (100% electrification) and a reference case.
What the Map Shows
The interactive map enables users to draw their own conclusions, but a few immediate takeaways:
- Nuclear power isn’t only for rich countries. Markets for nuclear power are found on all continents and in all income groups. Most of the largest potential markets are in rapidly growing countries of South and East Asia.
- We will need vast amounts of new electricity. Global electricity demand will more than double by 2050, and 90% will be outside of High Income markets. This is both a major challenge and a major opportunity.
- Over 80% of new electricity demand will be in countries that are ready—or nearly ready—for advanced nuclear technology. These fast-growing emerging markets are poised to take advantage of these rapidly developing new technologies.