
Policy gaps, regulatory opacity, and the risk of protracted arbitration can bog down or stymie investment in new power projects in most electricity markets across sub-Saharan Africa. But you can’t manage what you can’t measure. So the African Development Bank (AfDB) created the Electricity Regulatory Index (ERI) which has, since 2018, scored and published the results of an annual survey of African electricity regulators and utilities, now covering 36 countries.
What is the Electricity Regulatory Index?
The ERI measures the level of development of African electricity sector regulatory frameworks against international standards and best practices.1 It does not assess the level of power infrastructure development in a country, but rather the existence of policy and regulatory frameworks to address priority risks. Scoring consists of three sub-indices between 0 – 1:
The Regulatory Governance Index (RGI) assesses “the legal and institutional set up of the regulatory framework of a country. It is concerned with the existence and content of electricity sector regulations.”
The Regulatory Substance Index (RSI) assesses ”how the regulator has operationalized the mandate bestowed on it by the RGI in developing and implementing key regulatory instruments and frameworks for the sector.”
The Regulatory Outcome Index (ROI) assesses “the outcomes of regulatory decisions, actions, and processes on the sector from the perspective of regulated entities. It offers insights into how the actions of regulators have affected the performance of the sector.”
Five Takeaways
While any high-level scoring index has a limited ability to capture nuanced realities of policy implementation and impact, the survey results and how they change over time reveal some important trends in the evolution of the region’s regulatory environment for power.2
1. On-paper policies are mostly tight, but the gap between what’s on paper and the reality of regulatory outcomes remains large. The 2020 survey yielded an average outcomes (ROI of 0.393) score well below the substance (RSI of 0.545) and governance (RGI of 0.688) indicators. Less than a quarter of countries scored above 0.500 on the 2020 ROI, implying a disconnect at the implementation or enforcement stages of electricity sector regulation, primarily regarding tariff schedules. The majority (56%) are not charging tariffs that enable operational cost recovery. The implementation gap also extends to rural electrification: 69% of surveyed utilities “have regulatory mechanisms in place to facilitate electricity access, especially to rural customers,” but 58% of them are not funding rural electrification efforts.
2. The biggest gaps in regional electricity regulation are tariff-setting and quality of service (QoS). More than half of surveyed regulators “operate without a well-documented tariff methodology,” and many of the methodologies in place do not have “procedures and schedules for major tariff reviews as well as indexation and automatic tariff adjustment mechanisms.” Likewise, 55% do not have any QoS regulations. Of those that do, many do not have “clear cut ceilings, thresholds, incentives or penalties on some key QoS indices such as SAIDI and SAIFI.” One standout exception is Nigeria’s Service Reflective Tariff scheme implemented in 2020 (well-summarized by my Hub colleague Chigozie Nweke-Eze), which assesses distribution companies (DisCos) on availability, reliability (measured with SAIDI and SAIFI), and power quality (operating frequency and voltage stability). It then caps tariffs for customers receiving low-quality service, gradually moving tariffs towards cost-reflectivity as service improves. There is also an ongoing push for cost-reflective tariff reform among utility regulators in the Southern African Development Community.
3. The policy landscape for off-grid and captive power is maturing quickly. Newly tracked in the 2020 edition of the ERI, maturing policies for off-grid and captive power generation in Ethiopia, Uganda, Kenya, Togo, and Niger, among others, contributed significantly to the regional policy landscape for electricity access from distributed generation. Substantive, bankable policies for mini-grids, commercial and industrial (C&I) solar systems, and captive power installations at large industrial offtakers like mines, smelters, mills, factories, and other energy-intensive users support private investment into affordable, reliable power for underserved grid customers and typically displace standalone diesel or heavy fuel oil (HFO) generators for more remote customers without a grid connection.
4. Many African utilities got the financial short straw from pandemic relief packages. Lockdowns and restrictions brought on by the COVID-19 pandemic hurt utility revenues by increasing residential power demand and decreasing C&I demand, which spurred tariff hardship relief schemes and halted or reversed retail tariff reforms that had been progressing towards cost reflectivity. Tariffs temporarily bore varying degrees of weight in COVID-19 relief packages in Mozambique, Eswatini, Burkina Faso, Côte d’Ivoire, Ghana, Senegal, Liberia, Mali, Togo, Nigeria, Egypt, Mauritania, and Uganda, among others, while some countries, including Botswana, the Seychelles, and Zimbabwe raised tariffs to prop up state utilities when revenues fell.
5. Uganda stands out once again. In both the 2019 and 2020 versions of the ERI, Uganda is the top performer at 0.801 on the 2020 index, the only country in the “high level of regulatory development” category. Uganda is one of the region’s few markets with both a liberalized (since 2001) and financially viable electricity sector. Umeme, the largest distribution utility, is privately owned, has a 20-year concession for distribution and retail, and has become an example of regional best practice for fiscal discipline, public-private partnership, and transparent governance. Actis, the private equity partner that owned and operated Umeme’s concession for 11 years before a successful exit, managed the distribution utility from a weak fiscal position to more than tripling the share of the population connected to the grid, halving line losses, eliminating network-related fatalities, and increasing the bill collection rate to 98.4%.
AfDB will soon release the 2021 report, and the World Bank Group’s ESMAP team is working to globalize the methodology into a Global Electricity Regulatory Index (GERI), which will help benchmark the region’s regulatory performance against global progress.
Although regulatory progress across Africa’s electricity sector has been relatively choppy in recent years, the sector’s policy and regulatory landscape is increasingly robust. Technical and operational capacity amongst regulatory bodies and public utilities is expanding, and regional electricity market cooperation continues to deepen. Path-breaking utilities like Umeme, NamPower in Namibia, Ethiopian Electric Power, and Sonabel in Burkina Faso continue to set the tone for policy design, implementation, governance, and outcomes across the region.
FIGURE 1: 2018-2019 and 2019-2020 Year-on-Year changes in metrics for participating countries
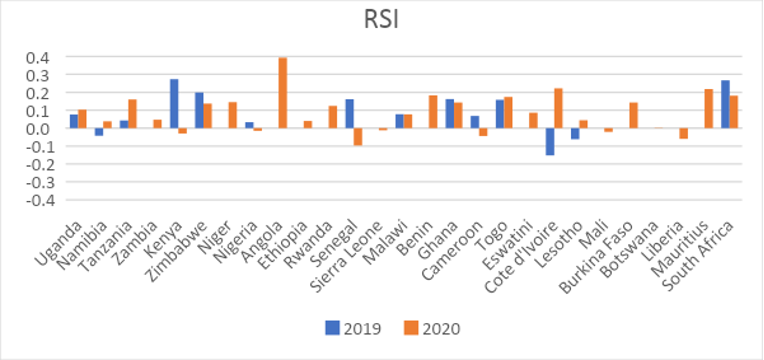
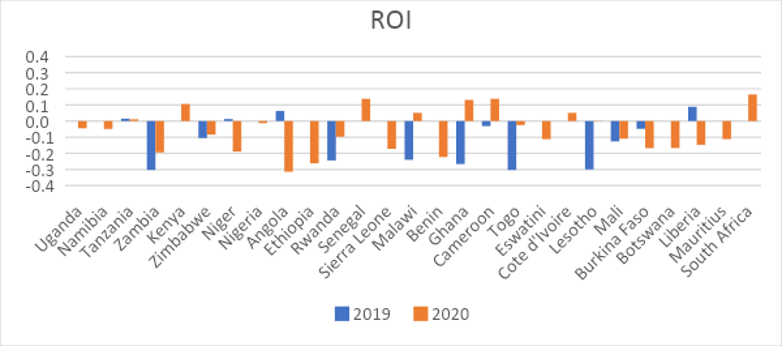
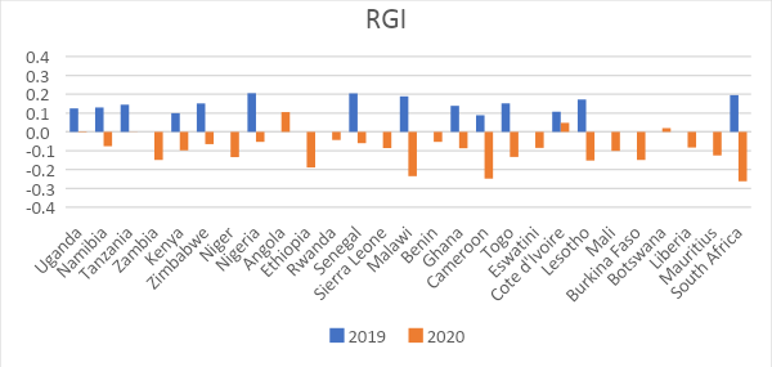
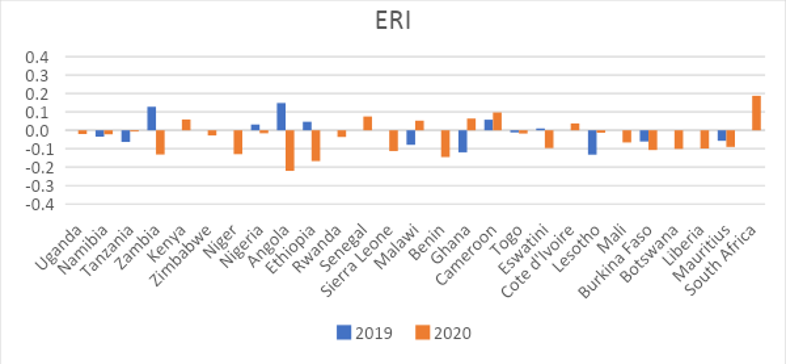
TABLE 1: Compiled AfDB 2018, 2019, and 2020 ERI results by participating country
| Country | 2020 | 2019 | 2018 | |||||||||
|---|---|---|---|---|---|---|---|---|---|---|---|---|
| – | RGI | RSI | ROI | ERI | RGI | RSI | ROI | ERI | RGI | RSI | ROI | ERI |
| Uganda | 0.925 | 0.945 | 0.686 | 0.801 | 0.922 | 0.842 | 0.635 | 0.7484 | 0.7974 | 0.7661 | 0.8750 | 0.8271 |
| Namibia | 0.817 | 0.782 | 0.721 | 0.759 | 0.893 | 0.744 | 0.590 | 0.6951 | 0.7634 | 0.7865 | 0.8563 | 0.8146 |
| Tanzania | 0.904 | 0.926 | 0.568 | 0.721 | 0.905 | 0.766 | 0.652 | 0.7383 | 0.7606 | 0.7232 | 0.7573 | 0.7496 |
| Zambia | 0.690 | 0.687 | 0.622 | 0.655 | 0.839 | 0.640 | 0.516 | 0.6175 | ||||
| Kenya | 0.828 | 0.888 | 0.468 | 0.633 | 0.926 | 0.918 | 0.577 | 0.7294 | 0.8266 | 0.6448 | 0.7031 | 0.7192 |
| Zimbabwe | 0.698 | 0.723 | 0.561 | 0.631 | 0.763 | 0.586 | 0.423 | 0.5339 | 0.612 | 0.3871 | 0.4542 | 0.4763 |
| Niger | 0.724 | 0.581 | 0.571 | 0.611 | 0.858 | 0.436 | 0.616 | 0.6313 | ||||
| Nigeria | 0.900 | 0.790 | 0.417 | 0.594 | 0.953 | 0.805 | 0.419 | 0.6069 | 0.7476 | 0.7719 | 0.7188 | 0.739 |
| Angola | 0.749 | 0.674 | 0.494 | 0.593 | 0.644 | 0.281 | 0.356 | 0.4056 | ||||
| Ethiopia | 0.657 | 0.674 | 0.519 | 0.587 | 0.846 | 0.634 | 0.354 | 0.5118 | ||||
| Rwanda | 0.805 | 0.848 | 0.407 | 0.580 | 0.848 | 0.724 | 0.669 | 0.7251 | ||||
| Senegal | 0.866 | 0.799 | 0.379 | 0.561 | 0.926 | 0.896 | 0.526 | 0.6922 | 0.7126 | 0.7345 | 0.4375 | 0.5644 |
| Sierra Leone | 0.750 | 0.511 | 0.498 | 0.561 | 0.836 | 0.523 | 0.511 | 0.589 | ||||
| Benin | 0.778 | 0.718 | 0.404 | 0.550 | 0.831 | 0.535 | 0.353 | 0.491 | ||||
| Malawi | 0.698 | 0.635 | 0.453 | 0.550 | 0.933 | 0.558 | 0.550 | 0.6401 | 0.7443 | 0.4803 | 0.7938 | 0.6971 |
| Ghana | 0.703 | 0.794 | 0.401 | 0.548 | 0.790 | 0.651 | 0.595 | 0.655 | 0.6516 | 0.4889 | 0.8979 | 0.7156 |
| Cameroon | 0.558 | 0.522 | 0.509 | 0.525 | 0.806 | 0.566 | 0.698 | 0.692 | 0.7175 | 0.4979 | 0.6854 | 0.6454 |
| Togo | 0.587 | 0.685 | 0.422 | 0.518 | 0.720 | 0.511 | 0.447 | 0.5247 | 0.5686 | 0.3531 | 0.750 | 0.5879 |
| Eswatini | 0.770 | 0.535 | 0.393 | 0.506 | 0.855 | 0.449 | 0.565 | 0.6069 | ||||
| Lesotho | 0.702 | 0.476 | 0.420 | 0.497 | 0.854 | 0.432 | 0.409 | 0.5128 | 0.6821 | 0.4940 | 0.3938 | 0.4812 |
| Côte D’Ivoire | 0.746 | 0.453 | 0.412 | 0.497 | 0.698 | 0.231 | 0.580 | 0.5188 | 0.5908 | 0.3834 | 0.6281 | 0.5531 |
| Mali | 0.708 | 0.498 | 0.323 | 0.441 | 0.809 | 0.519 | 0.490 | 0.5704 | ||||
| Burundi | 0.597 | 0.193 | 0.478 | 0.434 | ||||||||
| Guinea | 0.606 | 0.302 | 0.393 | 0.422 | ||||||||
| Madagascar | 0.659 | 0.527 | 0.260 | 0.393 | 0.808 | 0.384 | 0.309 | 0.4291 | ||||
| Mozambique | 0.642 | 0.412 | 0.277 | 0.382 | 0.622 | 0.410 | 0.389 | 0.448 | ||||
| Dem. Rep. of Congo | 0.401 | 0.357 | 0.375 | 0.377 | ||||||||
| Burkina Faso | 0.687 | 0.278 | 0.286 | 0.373 | 0.780 | 0.338 | 0.398 | 0.4717 | ||||
| Botswana | 0.681 | 0.305 | 0.228 | 0.336 | 0.806 | 0.870 | 0.451 | 0.4485 | ||||
| Gambia | 0.572 | 0.526 | 0.197 | 0.329 | 0.834 | 0.345 | 0.511 | 0.5491 | 0.6389 | 0.0784 | 0.4479 | 0.4008 |
| Liberia | 0.644 | 0.239 | 0.184 | 0.285 | 0.641 | 0.141 | 0.182 | 0.2668 | ||||
| Mauritius | 0.691 | 0.444 | 0.135 | 0.277 | 0.654 | 0.113 | 0.458 | 0.4188 | ||||
| Central African Republic | 0.549 | 0.321 | 0.159 | 0.263 | ||||||||
| Gabon | 0.508 | 0.253 | 0.165 | 0.250 | ||||||||
| Rep. of Congo | 0.373 | 0.306 | 0.167 | 0.238 | ||||||||
| Chad | 0.578 | 0.034 | 0.184 | 0.238 | ||||||||
| South Africa | 0.911 | 0.544 | 0.456 | 0.5814 | 0.778 | 0.5875 | 0.5958 | 0.6378 | ||||
| Algeria | 0.815 | 0.685 | 0.689 | 0.718853 | ||||||||
| Egypt | 0.801 | 0.605 | 0.684 | 0.693435 | ||||||||
| Mauritania | 0.792 | 0.272 | 0.609 | 0.569199 | ||||||||
| Morocco | 0.555 | 0.22 | 0.676 | 0.512141 |
Endnotes
- ERI 2020.
- It’s important to note that some of these year-on-year changes in the index results are to be attributed to changes in survey questions and participant types in the 2020 edition vs. the 2019 edition.